Power BI Online Course in Hindi
About Course
ESS Institute is thrilled to introduce its latest offering—an in-depth online course designed to help professionals with latest knowledge and practical skills in Power BI in Hindi. Power BI is a trending tool in data analysis and business intelligence, for data visualization, analytics, and interpretation. This course provides students with the expertise needed to work on data effectively in different domains, ranging from business analytics to make data-driven decisions.
What You Will Learn:
This course covers following topics in Hindi:
Introduction to Power BI: The course commences with a complete overview of Power BI, elucidating its significance in modern data ecosystems. Students will learn the fundamental concepts underlying Power BI, including its features, functionalities, and applications across different industries.
Understanding Architecture and Data Sources: Students will explore the architecture of Power BI and get clean data metrics with its components and interactions. Moreover, they will learn data sources such as Excel spreadsheets, CSV files, JSON datasets, and Python scripts within the Bi environment.
Data Visualization Techniques: Students will master the art of creating visually compelling and insightful charts, graphs, and dashboards using its intuitive interface. They will learn various visualization techniques to represent complex datasets effectively and communicate key insights to stakeholders.
Filters and Transformations: The course covers advanced data manipulation techniques, including filtering and transformations, enabling Students to preprocess and cleanse raw data efficiently. They will learn how to apply filters, perform data transformations, and handle common data cleansing challenges to ensure data accuracy and reliability.
Calculated Fields and Expressions: Students will know calculated fields and expressions, to derive metrics from existing data. They will learn how to create custom calculations, measures, and expressions using its powerful DAX (Data Analysis Expressions) language.
Dashboard and Reporting with DAX: Finally, the course explores dashboard and reporting capabilities in Power BI, augmented by the advanced functionalities of DAX. Students will learn how to design interactive dashboards and dynamic reports that provide actionable data and information
You can also learn offline at our Python institute in Delhi and learn from our Data analytics course offline
Course Content
Introduction of Power Bi
-
Power BI Modules
02:52 -
Power BI Installation
02:44 -
Power BI Interface
04:17
Power BI Data Visualization
Text Functions in Power Bi
Power Bi Filters
Power Query Editor in Power Bi
Insert Button
Insert Shapes
Insert Text
Insert Objects
Action page navigation
Action web Url
Bookmark Action
Project 1
Project 2
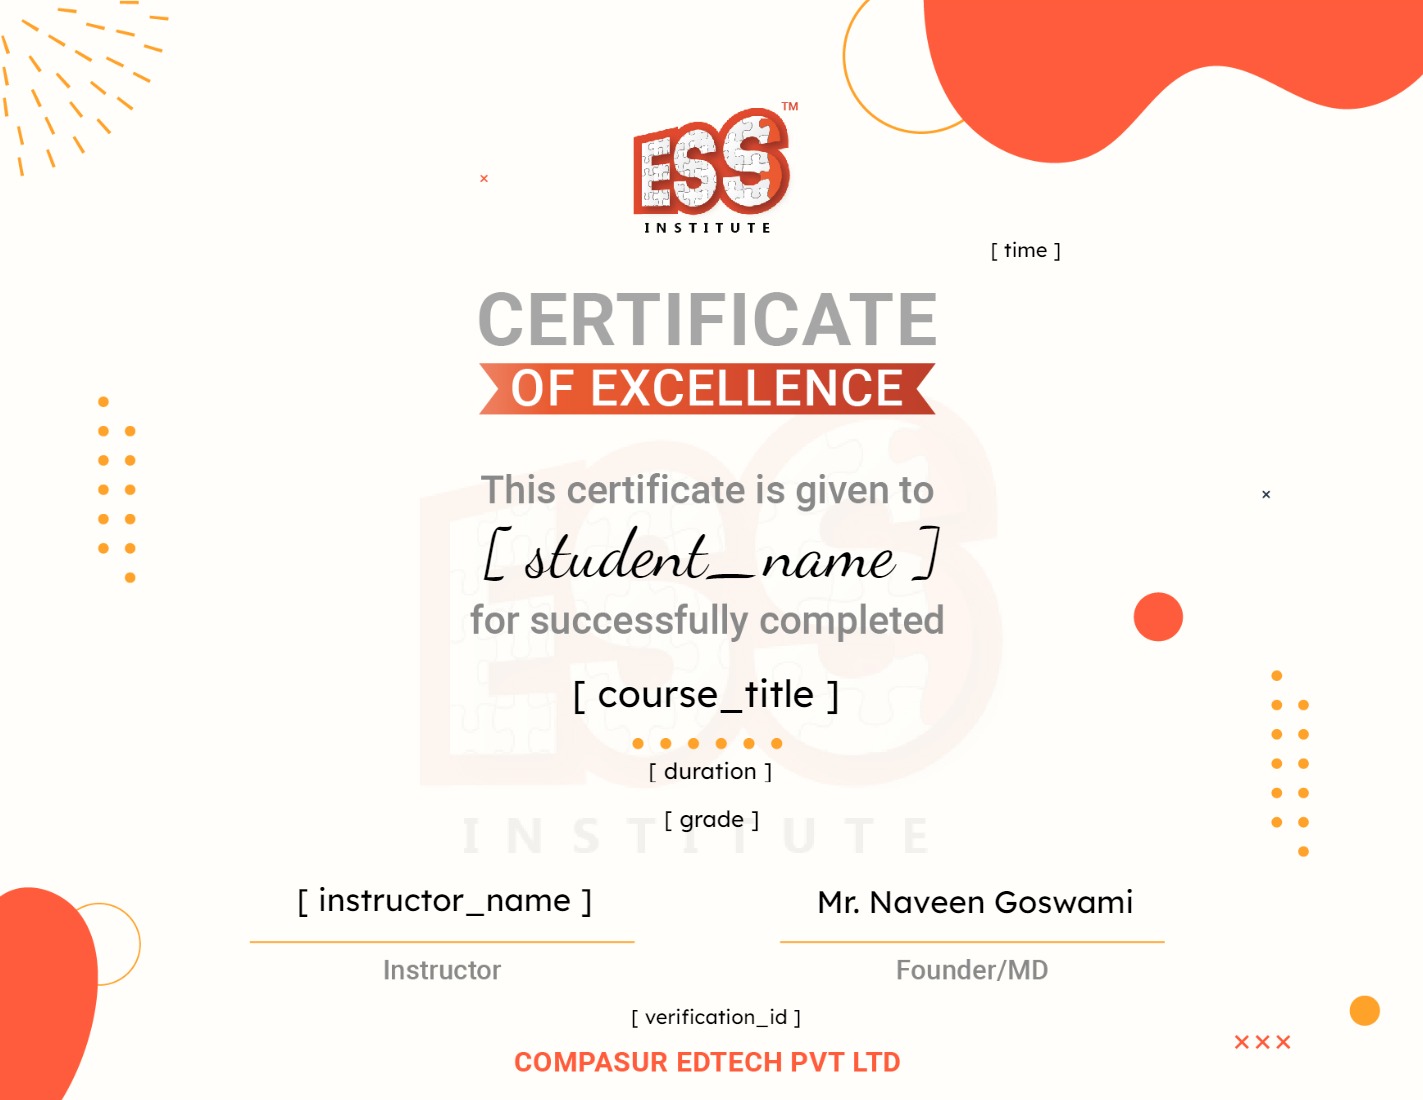
Earn a certificate
Add this certificate to your resume to demonstrate your skills & increase your chances of getting noticed.

Student Ratings & Reviews

